1985-2002 Patent Research Findings
(CREAX nv, Belgium)
[Japanese translation by T. Nakagawa is posted in our Japanese page, on Apr. 16, 2003. ]
Editor's
Note
(Toru Nakagawa, Apr. 15, 2003)
It is my great pleasure that the two papers of outstanding accomplishments presented at TRIZCON2003 by Darrell Mann and Simon DeWulf are reposted in this Web site by the courtesy of the Authors. This page contains their first paper, you can access to their second one by clicking "Updating the Contradiction Matrix". Please refer to my Personal Report of TRIZCON2003 posted on Apr. 3 and quoted here at the bottom of this page (I wish to guide you directly to their paper). I am very grateful to the Authors and the Altshuller Institute.Authors: Darrell Mann (Director, CREAX nv, Belgium). Email: darrell.mann@creax.com
Simon DeWulf (CEO, CREAX nv, Belgium). Email: simon.dewulf@creax.com
Company: CREAX nv. Belgium: Web site: http://www.creax.com/
Conference: The Altshuller Institue for TRIZ Studies, USA. Web site: http://www.aitriz.org/
| Top of this page | 1. Introduction | 2. Patent Research | 3. Level of Invention | 4. Trends of Evolution | 5. Inventive Standards | 6. Conclusions and Future Work | References | PS. Editor's Note |
| "Updating the Contradiction Matrix", Mann and DeWulf | CREAX Web site | TRIZCON2003, Nakagawa's Personal Report | Japanese
page of this paper |
Darrell MANNAbstract
Director, CREAX nv, Belgium
Phone/fax: +44 (1275) 342960
darrell.mann@creax.comSimon DEWULF
CEO, CREAX nv, Belgium
Phone: +32 57 229480, Fax: +32 57 229481
simon.dewulf@creax.com
A large part of the strength and power of TRIZ exists because the methodology was constructed on the foundations provided by the analysis of a substantial number of patents. Around 1985, however, this analysis was for the most part halted and the research focus was shifted to other important areas. In using some of the TRIZ tools on today’s problems – in a world, for example, that has become much more electrical and software based in its outlook – it is evident that they are not providing users with as much assistance as they could. With this in mind, a large programme of patent analysis was instigated in 2000 with the aim of extending TRIZ to accommodate the changes brought about by the advances that have taken place in business and technology since 1985. To date, around 150,000 patents from this period have been analysed and added to the TRIZ knowledge base. The paper describes the form, focus and findings of some of the research.
1. Introduction
There is growing evidence to suggest that while the high level philosophical elements of TRIZ remain valid, many of the detailed level tools are beginning to exhibit signs of strain in light of the changes that have taken place in the world during the last 15 or so years. To take three examples, the world is much less ‘mechanical’ and much more ‘electronic’ or ‘field-based’, there is much greater awareness of environmental issues – both in terms of designing systems that avoid generating further damage to the environment and using knowledge contained in the environment (most notably nature) to help us to design better systems, and the world is much more acutely aware of risk and safety-related design issues. On too many occasions, the tools of classical TRIZ can be seen to direct users in directions that are considerably sub-optimal compared to the ‘best practices’ of latter-day inventors working in these and other areas. This is not to say that research in the TRIZ domain has stagnated since the emergence of the classical tools; it quite clearly has not. But, it does seem clear that the bulk of research in recent times has made the assumption that sufficient data has been collected and that the research requirement involves re-arrangement and re-organisation of this data. It is the belief of the authors, and the theme of the paper that this type of research – while valuable – is nevertheless built on an assumption that is incorrect.
The paper records some of the ongoing findings
of a large-scale programme of research aimed at acquiring substantial quantities
of new data to feed into the TRIZ database. The full scope of the research
involves acquisition of data from the patent database, management sciences,
natural sciences and arts. In order to provide a degree of focus, this
paper concentrates its attention on the first of those four areas. The
paper includes the following sections:
2. Patent Research
The patent research being undertaken has adopted the following basic strategy: Every patent granted between the years 1985 and the present day is given at least a cursory evaluation in order to ascertain its potential contribution to the TRIZ database. Anyone that spends any time at all examining patents will know that there is a considerable proportion that have little of value to contribute to either the well-being of mankind or understanding of the inventive process – Figure 1. Nevertheless, for every patent, we make an assessment of the level of invention – using the classification structure formulated by Altshuller [1]. Then, for those patents we consider worthy of further analysis, we conduct a detailed examination of the invention disclosure looking to acquire data in four main areas of focus:-
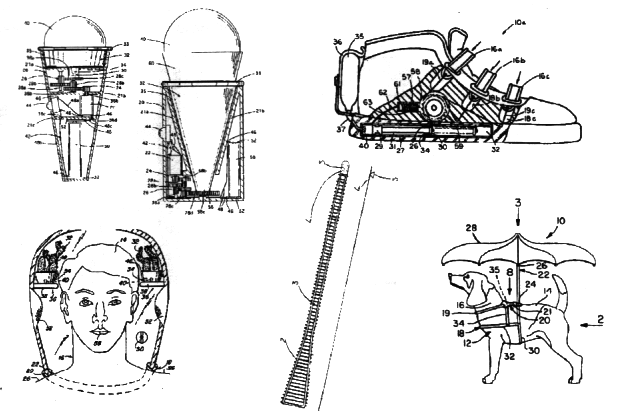
Figure 1: Some Inventions Excluded From
Detailed Analysis
Thus far, the analyses conducted have focused on
the US patent database. The final section at the end of the paper outlines
how we plan to extend our analysis to look at other patent sources in due
course. In the meantime, the following sections describe some of our current
findings:
3. Level of Invention
The classification of patents into the five levels defined by Altshuller [1] and the associated distribution of patents between the five categories is well known across the TRIZ community. We have been interested in establishing any changes to this distribution that might have occurred during the period between 1985 and the present day. The current results of the research are presented in Figure 2.
The main shift we observe relative to the data from ‘classical’ TRIZ findings is one away from Level 1 towards a greater proportion of Level 2 and Level 3 inventions. While we cannot be certain, the evidence from the citation indexes within the invention disclosures suggests that inventors are progressively more likely to look outside the horizons of their organisations. This is probably due in no small part to the massive increase in the availability and accessibility of patent data in recent times, and the growing awareness that intellectual property represents an important competitor discriminator as far as potential investors is concerned. The increase in the number of Level 3 inventions – where we are seeing an increasing number of ideas transferring from one industry to another – can also be expected to be due to the increasing availability of data, but also due to the fact that organisations are becoming increasingly aware of the possibilities of exploiting their intellectual capital in other sectors – the so called ‘Rembrandts in the Attic’ phenomenon [4].
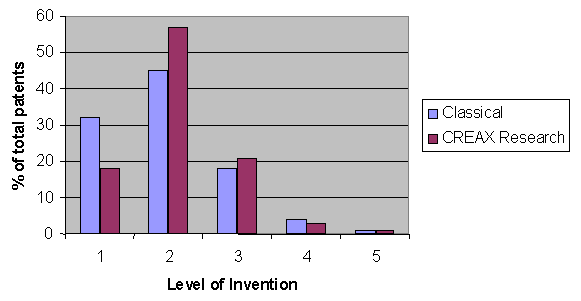
Figure 2: Comparison Between Classical and Updated Data on Level of Invention
The small reduction in the number of Level 4 inventions relative to classical TRIZ findings is difficult to explain, and we thus present the data as we find it without seeking to justify it in any way.
An aspect of patents that has not previously been published in the TRIZ literature (at least not in English) is the relationship and level of influence between different Levels of Invention. Our initial hypothesis prior to starting the research programme in earnest was that there was a definite link between Level 4/5 inventions and the subsequent creation of many Level 3, 2 and 1 inventions. While the subsequent research findings have certainly confirmed a link – Figure 3 – we have had insufficient data from the initial TRIZ research to establish any long term patterns regarding the dynamics of how quickly high level patents spawn lower level patents. Data for the last 15 years, however, indicates very definite trends towards accelerated production of lower level inventions as companies increasingly seek to build extensive IP protection ‘fences’ around their higher-level inventions before their competitors are able to do the same.
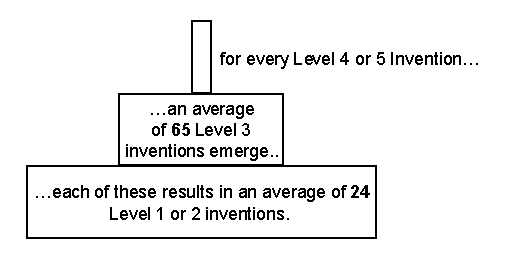
Figure 3: Clustering of Patents Between Different Levels of Invention
The data enabling the production of figures like that shown in Figure 3 is all available via the on-line patent databases, where we have in this case simply been able to match our own ‘level of invention’ data with the citations and references that are recorded for each patent.
What the data in effect suggests is that a Level
4 or 5 invention (say, for example, a rheopexic gel, or, to take an example
from a recent CREAX newsletter ‘patent of the month’ laser propulsion system)
will, over the course of the complete evolutionary cycle of the technology,
spawn on average over 1500 related patents.
4. Trends of Evolution
During our research, we have made no distinction between ‘patterns’ or ‘lines’ of evolution, choosing instead to focus on distilling out of the patent database individual trends of evolution that can be used to determine the evolutionary state of a particular system. We realise that there are many possible interactions that can and do take place between trends (see Reference [5] for example) and the fact that these ‘lines’ can become quite complicated, but have decided that in order to make best use of the trends in either a problem solving or strategic sense, it is best to allow the interactions to be mapped on an individual case basis. Our ‘trends’ then have been segmented in a way that we believe best illustrate key evolutionary phenomena.
Thus far we have identified a total of 35 trends of evolution relevant to technical systems. These trends are described in detail in Reference [6]. Reference [6] also describes the concept of evolutionary potential – the plotting of the evolutionary state of a system or invention along the trends. As far as our patent research is concerned, we are producing composite evolutionary potential radar plots for every patent we analyse. (We additionally plot radar plots for constituent parts of a system in addition to the composite plot if so requested by clients who wish to obtain a more detailed evolutionary picture.) During the patent research, in addition to plotting a composite evolutionary potential radar plot for an invention, we are also plotting the jumps made during the invention. Figure 4 illustrates a plot showing the current and pre-invention evolutionary state of a typical invention.
For every patent analysed, the process of constructing the radar plots involves examining each of the 35 trends to establish whether or not they are relevant to the invention.
For those trends that are deemed to be relevant, the researcher establishes where the invention is along each trend (for trends with discrete stages this is done simply by recording stage number, while for continuously variable trends (like ‘reducing density’ for example), a qualitative assessment is made of position along the trend scale), and also where was it prior to the invention.
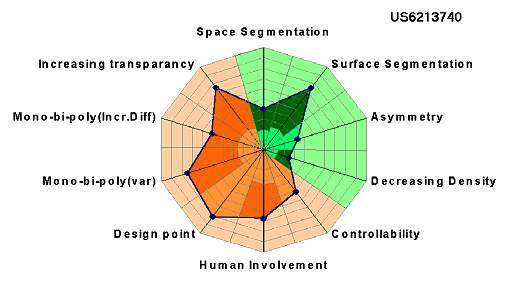
Figure 4: Example Evolutionary Potential Radar Plot Showing Jumps
Collectively, the trends present a means of benchmarking patents relative, not just to one another, but also to a global standard of ‘best practice’. This is important from the perspective of adequately protecting and advancing the state of the art within a given sector as the trends are effectively providing access to the ‘good’ evolutionary directions uncovered in some industries and disciplines, that otherwise have not been uncovered in others.
Figure 5 illustrates a typical group of evolutionary potential plots in an attempt to give an impression of the amount of work that is being conducted during the research.
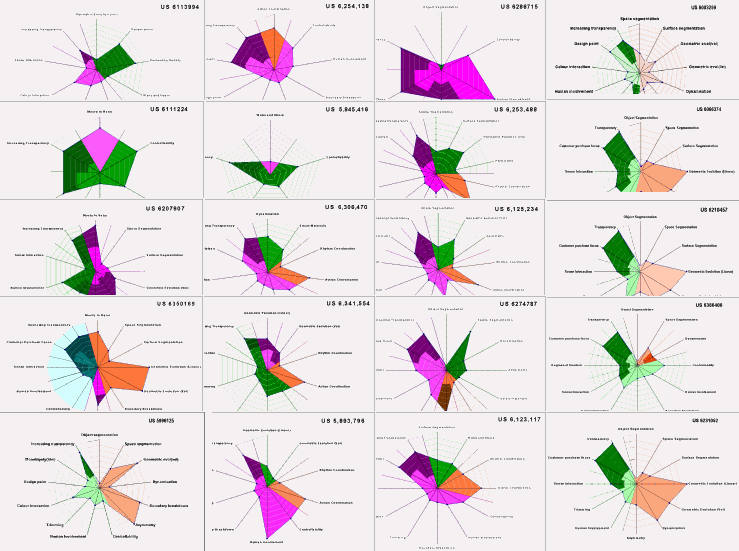
Figure 5: Typical Evolutionary Potential Radar Plots – Patents Involving Transparency Trend Jumps
All of the patents featured in the figure are connected by the fact that they feature inventions that have made jumps along the ‘increasing transparency’ trend uncovered during the research. The basic discrete steps of this trend are illustrated in Figure 6.

Figure 6: Increasing Transparency Trend of Evolution
Reference 6 refers to the trend in more detail – specifically identifying examples of the trend in action, and also some of the reasons why systems have made jumps from left to right along the trend. By way of further illustrating the breadth and depth of the patent research being undertaken, Figure 7 illustrates the types of technical contradiction that increasing transparency has been used to solve.
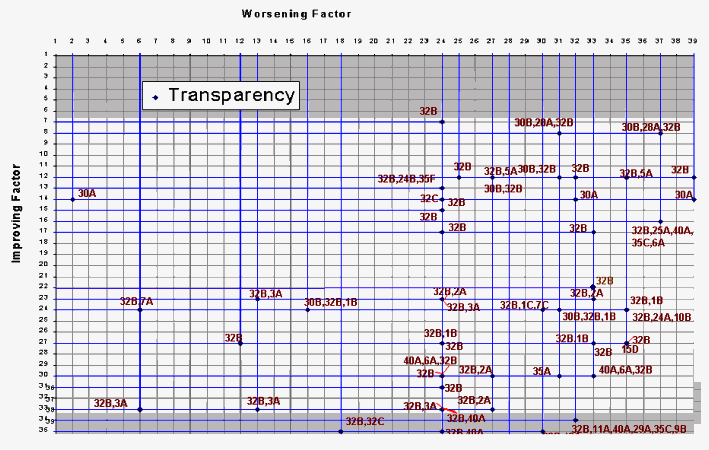
Figure 7: Increasing Transparency Inventions – Contradictions Solved Data
The figure suggests a much broader range of benefits and applications of increasing transparency than might otherwise be imagined.
Future papers and books [7]
will record similar data for other trends within the framework we have
devised. In the meantime, the main purpose of the description here is to
suggest at the size of the patent research we have determined to undertake.
5. Inventive Standards
The overlap between the Inventive Standards and the rest of TRIZ is most pronounced in terms of the Trends of Evolution – where we can see Classes 2, 3 and 5 very heavily correlated with the features and directions described in the trend stages discussed above and in Reference [6]. Consequently, our research has focused primarily on Classes 1 (‘composition and decomposition’) and 4 (‘measurement’).
With regard to Class 1 Inventive Standards, it
has long been our hypothesis that the S-Field part of the TRIZ toolkit
is of most value during the early evolution stages of a system, and so
our research has tried to establish whether there is a valid correlation.
As suggested by the data presented in Figure 8, the actual correlation
between use of Class 1 Standards and position along the s-curve of a system
turns out to be quite precise. This despite the inevitable uncertainties
that exist in judging the exact evolutionary state of a system described
in a patent. The figure clearly shows the Class 1 Standards generally being
deployed to generate the lower level patents found during the initial growth
periods of the s-curve.
| Evolution Stage |
|
|
| Conception/Birth |
|
|
| Infancy |
|
|
| Growth |
|
|
| Maturity |
|
|
| Retirement |
|
|
Figure 8: Correlation Between Use of Class 1 Inventive Standard and Evolutionary State
[Note by Nakagawa: Solutions using Class 1 Standards (i.e., Standard 1.1 and 1.2) are classified with respect to the Evolution Stage, and then their Average Levels of Invention are evaluated.]
This result should not actually be too surprising
in light of the fact that system part-count is generally increasing during
the initial stages of evolution, and the Inventive Standards are primarily
concerned with adding substances and fields to systems.
A further point of interest in this area relates to the overlap of Class 1 Standards and Inventive Principles like 24 – Intermediary, 5 – Merging, and 1 – Segmentation – which are all concerned with adding substances or fields to systems. When recording patents featuring these Principles, it is usually also possible to add an example to the Inventive Standard database. Although the Level of Invention of solutions employing just these Principles (and hence the Class 1 standards) is generally quite low, our research (Reference [8]) is also demonstrating that where the solutions are using these Principles or Inventive Standards in conjunction with other Principles, the average level of invention is significantly higher. In other words, higher-level solutions emerge from using combinations of Principles and Standards.
As far as Class 4 Inventive Standards are concerned, we have observed little if any correlation between the use of a Class 4 Standard and the evolutionary state of the system to which it is applied. Put simply, measurement problems can occur at any time during the life-cycle of a system.
To date, we have retained the original Inventive Standard descriptions found within classical definitions of Class 4 and observed that emerging solutions on the patent database all appear to fit reasonably well within the framework. As yet we have not examined in detail the mass of measurement solutions that have not been patented. The fact that Class 4 of the Inventive Standards is the best tool within the TRIZ toolkit to assist in the resolution of measurement problems means that we intend to conduct a more detailed examination of non-patented measurement solutions over the coming months.
With regard to the emergence of new Inventive Standards
more generally, we envisage that many of the new trends we have uncovered
will have an influence on the addition of new Inventive Standards. One
area of addition not readily covered by the trends is the increasingly
common use of additives with special properties to assist in the improvement
of systems. Reference 6 reflects this finding by adding two new Standards
to cover these eventualities, and also featuring resource lists intended
to act as prompt lists to encourage problem solvers to think about using
such additives. In the longer term, we envisage the need for a thorough
re-structuring of the Inventive Standards. In the first instance, however,
prior to committing the resource necessary to do the work, we need to be
more confident that the S-Field part of TRIZ is going to remain as a viable
individual tool – as opposed to being subsumed into other parts of the
toolkit. As the time for this decision approaches, we will publish our
current findings in more detail than the space here has permitted.
6. Conclusions and Future Work
The programme of research to update TRIZ has generated several new trends, new Inventive Standards and has provided significant new data on the evolutionary state of systems relative to a global benchmarking scale. It has also provided, for the first time, detailed information on the frequency and purpose of use of different parts of the TRIZ problem solving toolkit. For these reasons alone, we propose that the research has justified the significant investment we have made.
There appears to be a considerable amount of interest from industry in taking locally relevant data from the overall research findings. On one level, of course, this kind of activity diminishes the power of easing the transfer of best practice between different industries, but the practicalities and constraints of many industrial environments dictate a need for more closely monitored benchmarking between solutions within the same sector. We are currently working with several clients to assist them in this process – constructing strategic reports based only on those parts of the total patent data directly relevant to the specific industry (or even product within a sub-set of an industry as may be requested by the client).
We are also continuing the research in the interests of furthering the state of the art of TRIZ methods. In an ideal world, the raw data used in the construction of the tools of classical TRIZ will become available in the public domain. If this proves not to be possible for whatever reason, the value we have obtained through conducting an analysis of patents granted during the period 1985-2000, may well justify extension to examine (or re-examine) some of the patents granted prior to these dates.
In the meantime, we anticipate making more of our
findings available to the world at large through other publications.
References
[1] Altshuller,
G., ‘Creativity As An Exact Science’, Gordon and Breach, 1984.
[2] Mann,
D.L., Dewulf, S., ‘Updating the Contradiction
Matrix’, paper to be presented at TRIZCON 2003, Philadelphia, March
2003.
[3] www.creax.com
[4] Rivette,
K., Kline, D., ‘Rembrandts in the Attic: Unlocking the Hidden Value of
Patents’, Harvard Business School Press, 1998.
[5] Mann, D.L.,
Dewulf, S., ‘Evolutionary Potential: The Next Stage’, paper presented at
TRIZ Future Conference, Strasbourg, November 2002.
[6] Mann, D.L.,
‘Hands-On Systematic Innovation’, CREAX Press, April 2002.
[7] Mann, D.L.,
Dewulf, S., ‘Trends’, CREAX Press, to be published summer 2003.
[8] CREAX newsletter,
‘Combining Inventive Principles’, www.creax.com, February 2003.
PS.
Editor's Note (Toru Nakagawa, Apr. 15, 2003)
In my Personal Report of TRIZCON2003, I reviewed this paper and the second paper as follows:
The two papers by Darrell Mann and Simon DeWulf (CREAX, Belgium) [27], [28] are the most important accomplishment in the present Conference. Ref. [27] is "Updating TRIZ: 1985-2002 Patent Research Findings". It is well known that TRIZ was founded and extended by Altshuller through his intensive analysis of patents. However, such patent analysis was done mostly in 1970s to around 1985, and newcomers of TRIZ often complain that various examples in TRIZ are somewhat old-fashioned. In this context, CREAX company started a large researcch program to analyze all the US patents granted during the period from 1985 to the present, with the aim of re-establishing the whole TRIZ principles and knowledge base. They operate a laboratory in India with 25 full-time patent analysts and have analyzed about 150,000 patents so far since 2000.It is also my pleasure to tell you that the Japanese translation of Darrell Mann's Textbook, "Hands-On Systematic Innovation", is currently under progress. As a result of collaboration by nearly-20 voluntary engineers in Japanese TRIZ community, the first manuscripts of the whole volume have already been prepared, with the hope of publishing it in October, 2003.Professional patent analysts of various specialty fields were trained with TRIZ concepts and the framework of the present analysis. Then they reviewed the patents one by one, to evaluate its Level of Invention (according to Altshuller's criteria), and (after excluding the lowest-quality patents) to clarify the following items in parallel.
(1) Contradictions identified/solved by the Inventor, and Inventive Principles used for solving the problem.
(2) In a single composite evolutionary potential radar plot, the status of the problem and the status of the solution. Any emerging new trend, if identified.
(3) Physical, chemical, or biological effects employed to solve the problem.
(4) Inventive Standards used in the solution generation, or any new candidate of Inventive Standards.
All these findings were recorded in a fixed format in PC, together with the identification of the patent and its human extracted abstract. The quality of this progam certainly depends on the analysists' consistent understanding of TRIZ concepts, program framework, and individual patents. About 10 patents can be processed by one researcher per day, the Author says.Accumulation of the findings of this program has been reflected partly in Darrell Mann's textbook "Hands-On Systematic Innovation" (CREAX, 2002), and will be published in various other forms in the near future.
Ref. [28], "Updating the Contradiction Matrix", introduces the first aspect of the results obtained in the above program. Altshuller's Contradiction Matrix has been completely remodelled with improved framework and modern data! The parameters of the matrix are re-defined and extended into 50 (as the results of intensive discussions with user community). The results of the patent analysis reported above in [27] are expressed in the familiar format of Altshuller's Matrix with updated data and also in a new format called Matirx Explorer. It is announced that a new book "Matrix 2003: Updating the TRIZ Contradiction Matrix" (coauthored by D. Mann, S. DeWulf, B. Zlotin, and A. Zusman) will be published in April, 2003.
Changes in Matrix contents are demonstrated in some examples in the paper. It is also demonstrated that the Contradiction Matrix is readily customizable to any specific field of application. Thus, for example, the Matrix specifically for software development problems will be made as a 22x22 Matrix and will be published in a booklet.
These papers [27, 28] are based on so much eraborate work and important for modernizing and proliferating TRIZ. They will be posted in CREAX Web site, in TRIZ Journal, and soon in this "TRIZ Home Page in Japan" both in English and in Japanese translation under the author's permission.
| Top of this page | 1. Introduction | 2. Patent Research | 3. Level of Invention | 4. Trends of Evolution | 5. Inventive Standards | 6. Conclusions and Future Work | References | PS. Editor's Note |
| "Updating the Contradiction Matrix", Mann and DeWulf | CREAX Web site | TRIZCON2003, Nakagawa's Personal Report | Japanese
page of this paper |
Last updated on Apr. 16, 2003. Access point: Editor: nakagawa@utc.osaka-gu.ac.jp